
Business Information Technology Student

Hi, I'm Layan Khayyat

I turn raw data into decision-ready insight — building BI dashboards, cleaning and modeling data, and crafting the interfaces that make performance visible.

0+
Tools & Languages
0K+
Orders Analyzed
0
Companies Worked With
Layan Khayyat
Power BI
Python
SQL
Scroll

From raw data to real decisions

Layan working with data

I've always liked figuring out how a business actually works underneath the surface — the systems, the data, the decisions no one sees. That curiosity is what led me to study Business Information Technology at Princess Sumaya University for Technology (PSUT).

My focus sits at the intersection of business and technology — I clean, model, and visualize data so it's ready for the decisions that actually depend on it. I've built interactive Power BI dashboards, KPI reporting systems, and analytics pipelines combining Python, SQL, and Excel, and I care just as much about how that information is presented as I do about the numbers behind it.

Outside of BI work, I've designed client-facing websites and contributed to UI design and structured information presentation as a Design Intern — so I bring both the analytical and the visual side of information systems to the table.

I'm always looking to grow — picking up new tools, staying current with trends in data and technology, and continuously sharpening my skill set.

Education

B.Sc. Business Information Technology, PSUT

Languages

Arabic (Native), English (Advanced), German (Intermediate)

Based in

Amman, Jordan

Skills & Tools

Business Intelligence

Power BI, DAX, Dashboard Development, KPI Reporting

Power BIDAXPower Query

Programming Languages

Building analytical tools and interfaces end to end

PythonJavaScriptHTML/CSSDartNode.js

Databases

Structuring and querying relational data efficiently

SQLRelational DatabasesQuery Optimization

Data Handling

Cleaning, validating, and modeling data for reporting

Data ModelingData CleaningPerformance Reporting

Excel

Advanced spreadsheet modeling and automation

Excel — ExpertPivotTablesVBAAdvanced Formulas

UI & Interface Design

Structured information design for clarity and usability

UI DesignInformation DesignFigma

Certifications

Experience

05/2023 – 10/2023

Business Intelligence Trainee

Concentrix — Amman, Jordan

  • Designed and developed interactive Power BI dashboards to track business performance and support decision making.
  • Built and maintained KPI reports to monitor key operational metrics and improve visibility of performance trends.
  • Collaborated within cross-functional teams to deliver a complete data analytics solution combining Python, Excel, and Power BI.
09/2024 – 11/2024

Design Intern

INJAZ Al Arab — Amman, Jordan

  • Contributed to tasks involving user interface design and structured information presentation.
11/2024 – 12/2024

Part-time Tutor

Pi Educational Center & Math Club — Amman, Jordan

  • Provided academic support and explained complex concepts clearly, strengthening verbal communication and the ability to simplify technical material for varied audiences.

Projects

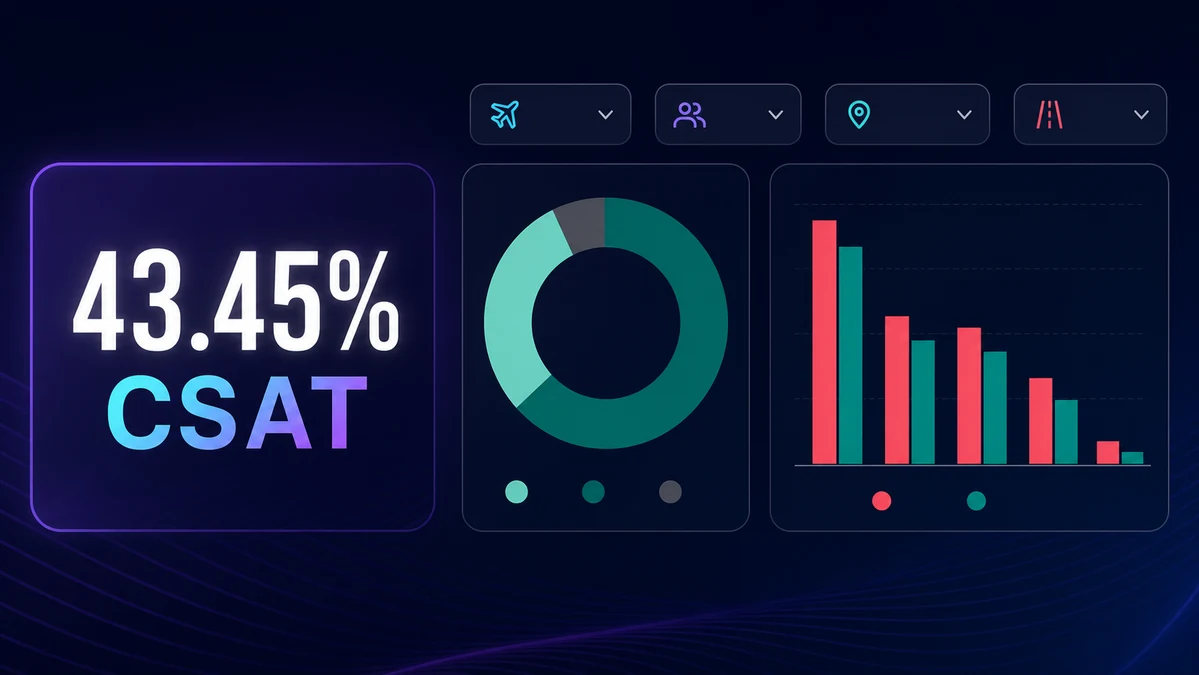
Power BI passenger satisfaction dashboard with KPI cards, charts, and slicers
Designed & Analyzed

Power BI Business Performance Dashboard

The problemPassenger satisfaction survey data was raw and scattered, with no easy way to see which parts of the travel experience were dragging scores down.

The resultAn interactive dashboard with slicers and filters that lets anyone track CSAT against target and drill into satisfaction by flight class, delay length, and service.

129,880Surveys
43.45%CSAT
+24.1%vs Target

Key insightSatisfaction dropped steadily as departure delays got longer — from about 46% satisfied among on-time passengers down to roughly 36% for those with major delays.

Power BIDAXPower Query
Live Demo
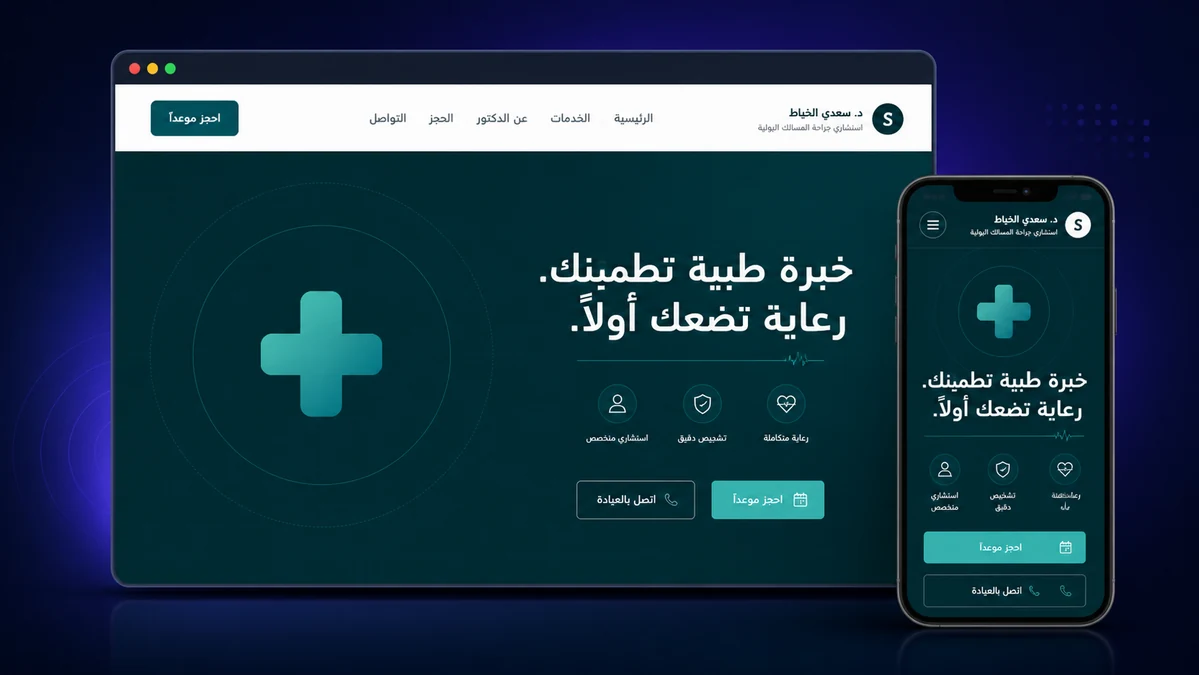
Dr. Sadi clinic website homepage on desktop and mobile
Designed & Developed

Business Website Development

The problemA medical clinic had no online presence, so patients had no way to learn about services or reach the clinic outside of a phone call.

The resultA responsive, Arabic (RTL) website built and deployed with HTML, CSS, and JavaScript, covering services, doctor info, and booking/contact actions.

RTLArabic-First
100%Responsive

Key insightBuilding the layout RTL-first from the start avoided the common mistake of retrofitting an English-first design — every component had to be mirrored correctly, not just the text direction.

HTMLCSSJavaScript
Live Demo
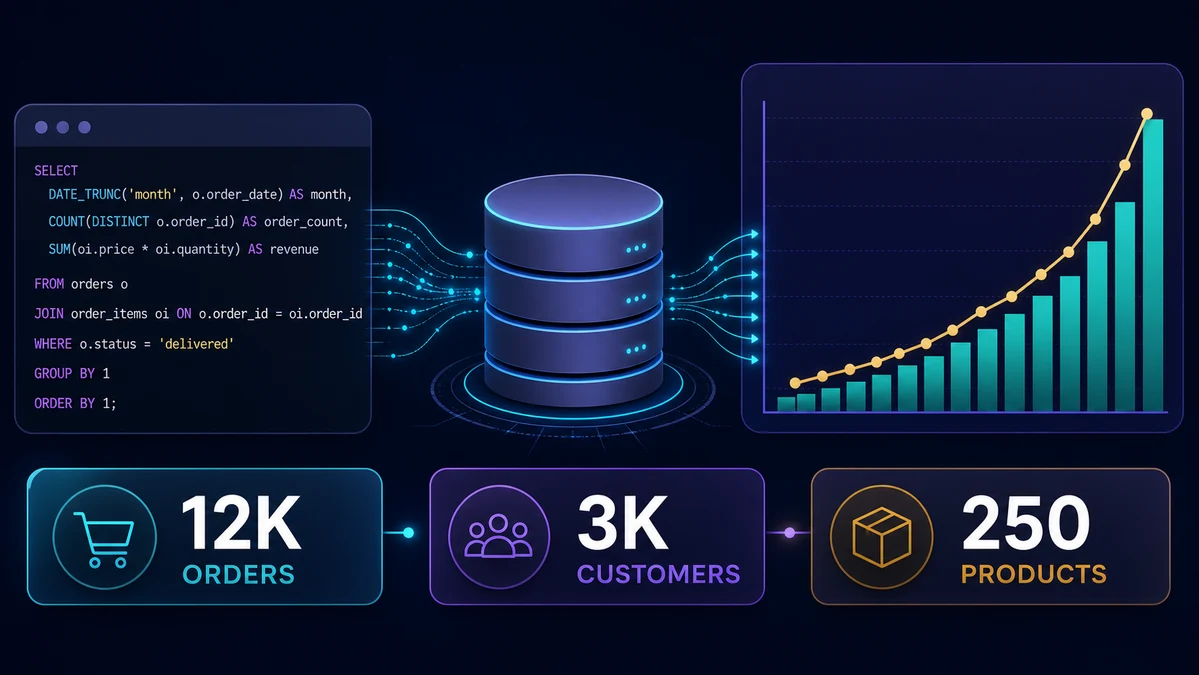
SQL query, database, and monthly revenue growth chart with order, customer, and product scale figures
Analyzed

SQL & Python: E-Commerce Sales Analysis

The problemRaw order-level data was too large to review manually, making it hard to see real revenue and customer trends underneath the noise.

The resultSQL queries extracted and aggregated the data; Python handled the statistical analysis and visualization, surfacing clear month-over-month growth patterns.

12,000Orders
3,000Customers
250Products

Key insightMonthly revenue didn't grow at a steady pace — it accelerated sharply in the later months, meaning recent customer acquisition mattered far more to total revenue than early-period activity.

SQLPythonData Analysis
View Code
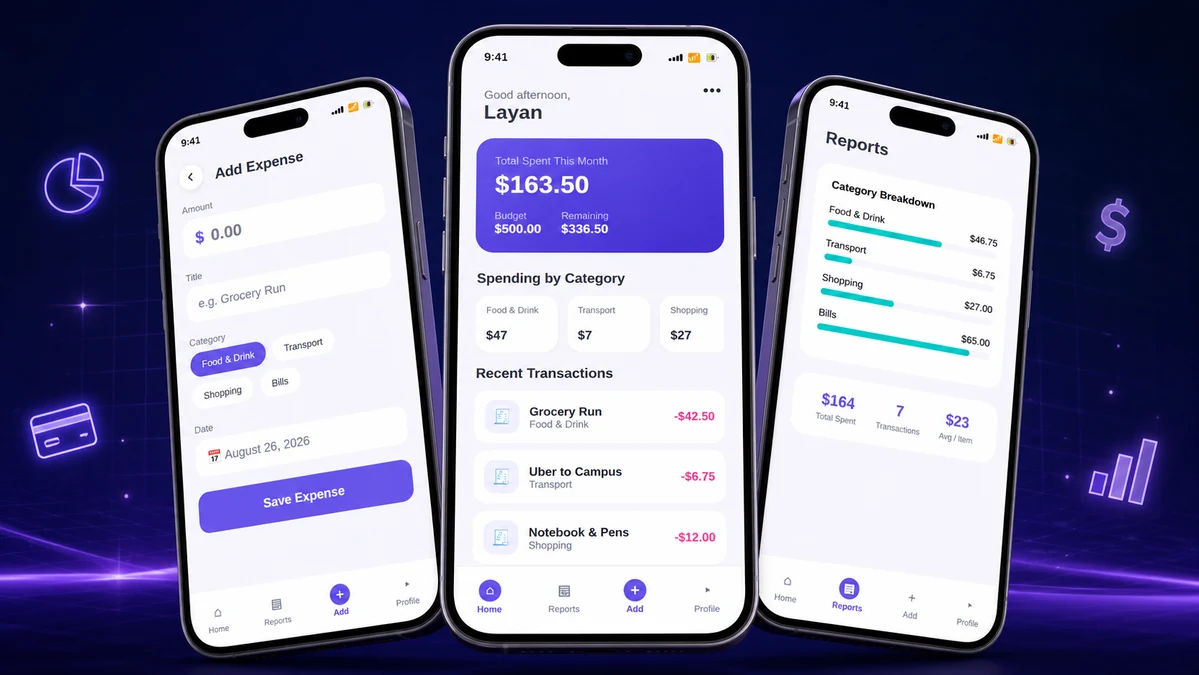
Expense Tracker Flutter app — Add Expense, Dashboard, and Reports screens on phone mockups
Designed & Developed

Expense Tracker Mobile App

The problemCasual spending is easy to lose track of when it's split across notes, bank apps, and memory, with no simple view of where money is actually going.

The resultA 4-screen Flutter app concept — Dashboard, Add Expense, Reports, Profile — for logging spending and reviewing it by category and budget.

4Core Screens
6+Categories

Key insightDesigning the Home screen made it clear the summary card had to answer "how much can I still spend?" in under a second — so it leads with budget remaining, not the transaction list.

FlutterDartMobile UI
View UI Overview
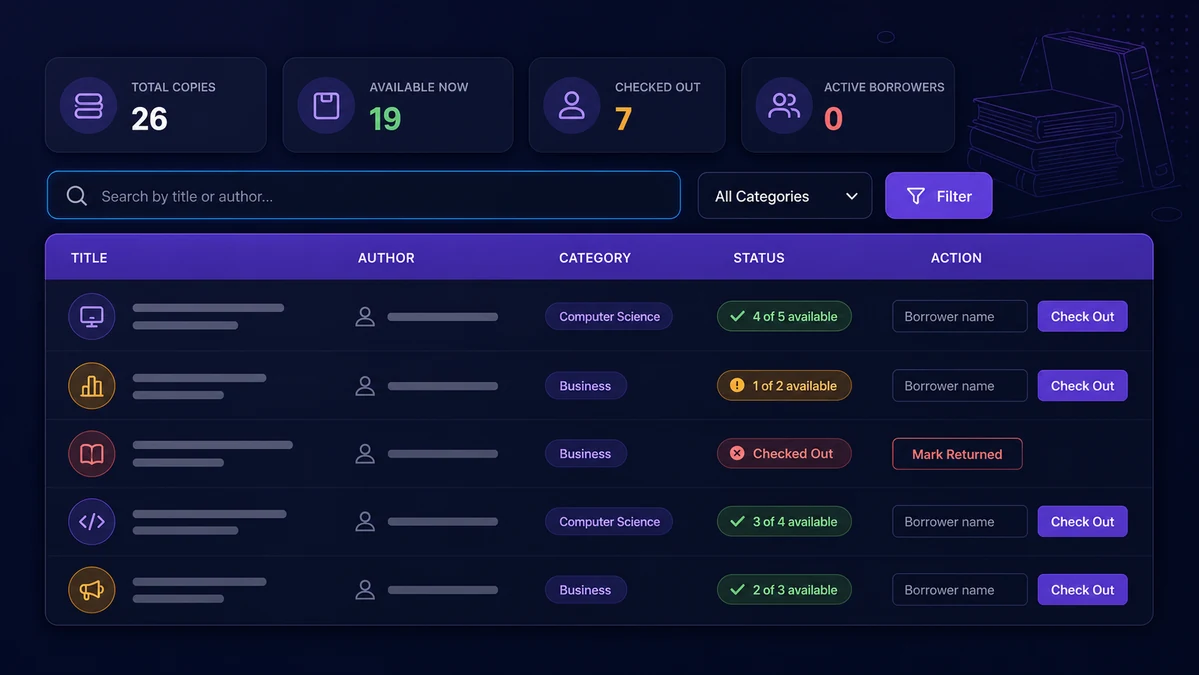
Library Manager app showing book inventory stats, search, and checkout controls
Designed & Developed

Library Management System

The problemSmall book collections are usually tracked in a spreadsheet, making it slow to check what's available or record who borrowed what.

The resultA real Python + SQLite web app where search, category filtering, and check-out/return actions all read from and write to a live database.

8Titles Tracked
26Total Copies

Key insightHandling multi-copy books surfaced a real edge case: returns have to resolve against the oldest active checkout record, not just any record, or the availability count would drift over time.

PythonFlaskSQLite
View Walkthrough
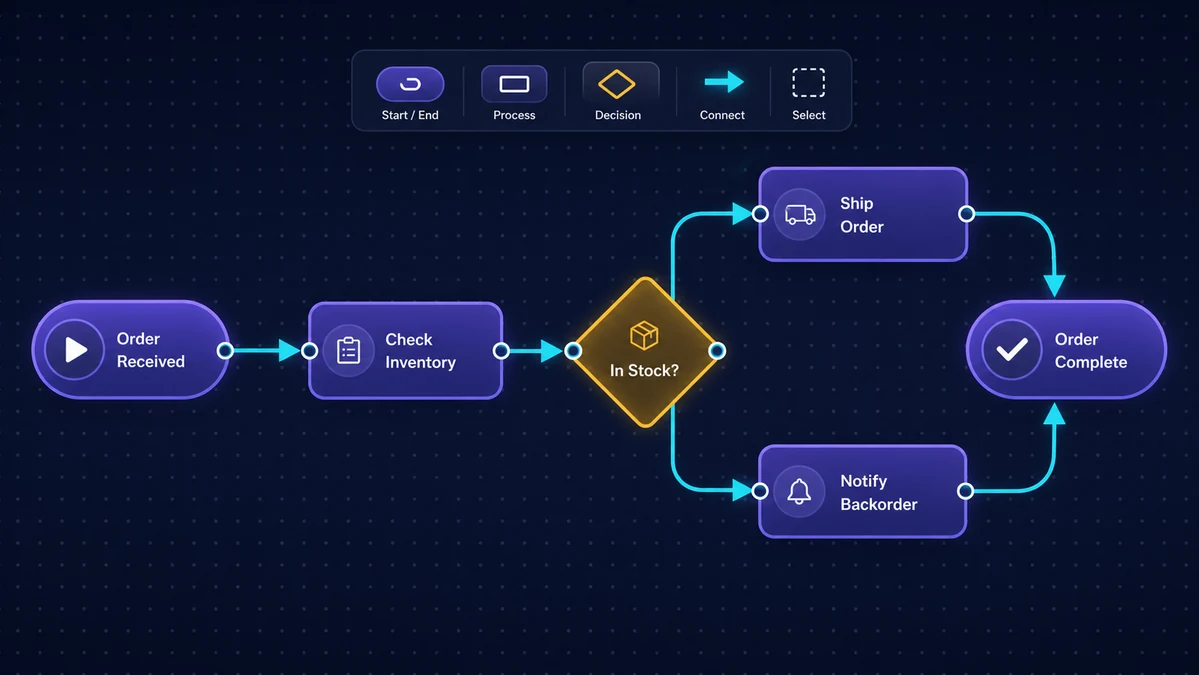
Business Process Flow Builder showing a drag-and-drop order fulfillment process diagram with a toolbar
Designed & Developed

Business Process Flow Builder

The problemMapping how a business process actually works usually means a text description or paid diagramming software — nothing lightweight and free.

The resultA drag-and-drop diagramming tool with connectable steps and decision points, built entirely in vanilla JavaScript and SVG with zero dependencies.

3Shape Types
0Dependencies
100%Client-Side

Key insightTesting the drag interaction surfaced a real bug — the editable label was silently blocking every drag click. Fixing it meant separating single-click drag from double-click edit.

HTMLCSSJavaScript
View Walkthrough
Layan Khayyat

Let's build something data-driven

Open to internships, collaborations, and BI/analytics opportunities. Reach out — I'd love to hear from you.